User Engagement
The User Engagement panel is the first and largest section in Usage Analytics. It provides a complete picture of how all of the users are interacting with the platform during the selected time period.
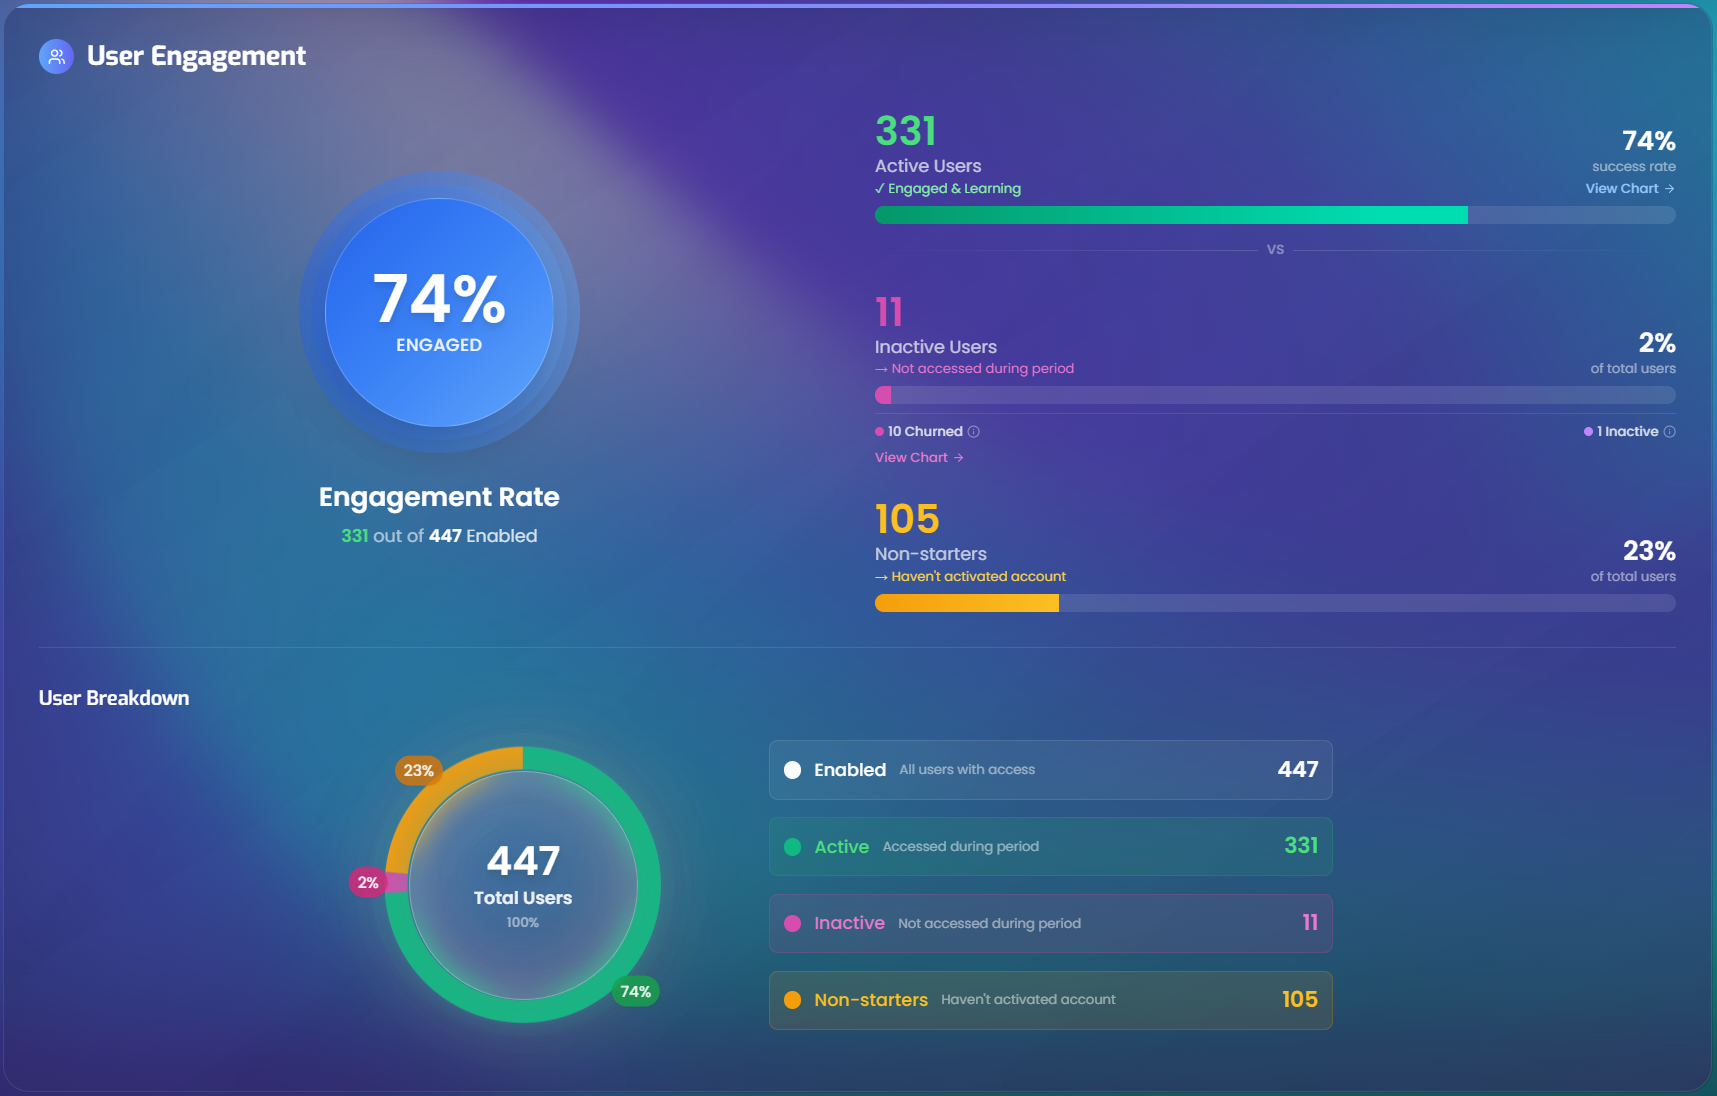
What data is shown
This panel answers a single key question: of all users invited to the platform, how many are actually using it?
All numbers in this section are based on the selected filters - the time period, user groups, and courses. When any filter changes, the counts recalculate.
The data includes:
- How many users have been given access (sent an activation email) up to the end of the selected period.
- How many of those users activated and logged in during the selected period.
- How many activated but didn't log in, and whether they've been away long enough to be considered "churned".
- How many never activated their account at all.
Engagement Rate
On the left side of the panel, a large animated circle displays the overall engagement rate - the percentage of enabled users who were active during the selected period.
Below the circle, the panel shows the actual numbers: for example, 42 out of 100 Enabled.
The circle's color changes based on the engagement level:
| Engagement | Color |
|---|---|
| 80% or higher | Green |
| 60–79% | Blue |
| 40–59% | Purple |
| Below 40% | Pink |
Active vs Inactive comparison
On the right side of the panel, users are split into groups with progress bars showing their proportion:
Active Users
Users who accessed the system during the selected period. Shown in green with a count, percentage, and a progress bar. Clicking this section scrolls down to the Active Users chart.
Inactive Users
Users who did not access the system during the period. This group is further broken down into:
- Churned - Users who have been inactive for 3 or more months since their last session or since they activated their account. Shown with an info tooltip.
- Inactive - Users with no platform activity during the selected period, but who haven't crossed the 90-day churned threshold yet.
Clicking the inactive section scrolls to the Churned Users chart.
Non-starters
Users who received an activation email but haven't activated their account yet. Displayed in amber with a count and percentage.
If there are no non-starters (the count is 0), this section is hidden from the display.
User Breakdown chart
At the bottom of the panel, an interactive donut chart provides a visual breakdown of all user groups.
The chart shows up to three segments:
| Segment | Color | What it represents |
|---|---|---|
| Active | Green | Users who accessed the system during the period |
| Inactive | Pink | Users who did not access the system (combines non-active and churned) |
| Non-starters | Amber | Users who haven't activated their account |
The center of the donut displays the total number of Enabled users (100%).
Interactive features:
- Hovering over a segment in the chart highlights the corresponding row in the legend (and vice versa).
- Segments with a value of 0 are automatically hidden from both the chart and the legend.
- Percentage labels appear on the outer edge of each segment.
Legend
The legend on the right side lists each group with its count:
- Enabled - All users with access (the total).
- Active - "Accessed during period".
- Inactive - "Not accessed during period".
- Non-starters - "Haven't activated account" (only shown when the count is greater than 0).
User group definitions - detailed criteria
Understanding exactly what each group means is important for accurate reporting. Below is the exact set of checks the system uses to classify every user. Each user falls into exactly one group.
Step 1: Who is "Enabled"? (the starting pool)
Before classifying users into groups, the system first determines the pool of users to analyze. A user is included in the pool - and counted as Enabled - only if all of the following are true:
- An activation email was sent to them - The admin has invited the user to the platform and the invitation email was delivered.
- The activation email was sent before the end of the selected period - Users who were invited after the end date of the selected time period are not counted.
- They are assigned to at least one course - Users must be enrolled in a course to appear in Usage Analytics.
- Their course enrollment is activated - The course assignment must be in an active state.
- They match the selected filters - If specific regions, cohorts, or courses are selected in the filter bar, only users belonging to those selections are included.
The Enabled count is the total audience - the denominator for all engagement calculations.
Step 2: Is the user a Non-starter?
Once the pool is determined, the system checks each user one by one. The first check is:
Has this user activated (signed into) their account?
A user is classified as a Non-starter if either of these is true:
- They have never activated their account at all - they received the invitation email but never clicked the link and signed in.
- They activated their account after the end of the selected period - from the perspective of the chosen time range, they hadn't activated yet.
Practical takeaway: Non-starters are users who have been given access but haven't taken the first step. They may need a reminder email or a follow-up from their manager.
If there are zero non-starters, the Non-starters section is automatically hidden.
Step 3: Did the user have activity during the selected period?
For users who have activated their account (i.e., they are not non-starters), the system looks at their portal login sessions - records of when the user logged into the Menta web platform.
Activity is based on portal logins only, not on simulation usage. This means a user who logged into the platform but did not start any simulation will still be counted as Active. Simulation-related metrics (session time, simulations played) are tracked separately in their own panels.
A user is counted as having activity in the selected period if they have at least one session that meets all of these conditions:
- The session occurred after the user's activation email was sent - any sessions recorded before they were officially invited are not counted.
- The session falls within the selected time period - either the session was started or last updated within the selected date range.
If the user had at least one qualifying session -> they are Active.
If they had no qualifying sessions -> the system moves to the next step to determine whether they are Non-active or Churned.
Step 4: Non-active vs Churned
For users who activated their account but had no sessions during the selected period, the system determines how long they've been away:
If the user has had sessions in the past (before the selected period):
- The system finds their most recent session (before the end of the selected period).
- It calculates the number of days between that last session and the end of the selected period.
- If it has been more than 90 days -> the user is Churned.
- If it has been 90 days or fewer -> the user is Non-active.
If the user has never had any sessions (they activated but never logged in after):
- The system uses their activation date instead of a last session date.
- It calculates the number of days between when they activated and the end of the selected period.
- If it has been more than 90 days since activation -> the user is Churned.
- If it has been 90 days or fewer since activation -> the user is Non-active.
In plain terms:
- Non-active = "They've been away, but it hasn't been that long - they might come back."
- Churned = "They've been away for more than 3 months - they're unlikely to return without intervention."
Summary of all checks
| Group | Activation email sent? | Account activated? | Sessions during period? | Time since last activity |
|---|---|---|---|---|
| Enabled | Yes (before period end) | - | - | - |
| Non-starter | Yes | No (or after period end) | - | - |
| Active | Yes | Yes (before period end) | Yes (at least one) | - |
| Non-active | Yes | Yes | No | ≤ 90 days |
| Churned | Yes | Yes | No | > 90 days |
How these groups relate to each other
Enabled (total)
├── Active              (activated + had a session during the period)
├── Non-active          (activated + no sessions in period + last activity ≤ 90 days ago)
├── Churned             (activated + no sessions in period + last activity > 90 days ago)
└── Non-starters        (never activated, or activated after the period ended)
Every enabled user falls into exactly one of these four groups. Together they always add up to the total enabled count.
The Inactive segment in the donut chart combines Non-active and Churned users into a single visual group, since both represent users who are not currently engaging with the platform.