Satisfaction Metrics
The Satisfaction Metrics panel shows how learners feel about their training experience. It sits in the lower-right of the page, side by side with the Simulations Played panel.
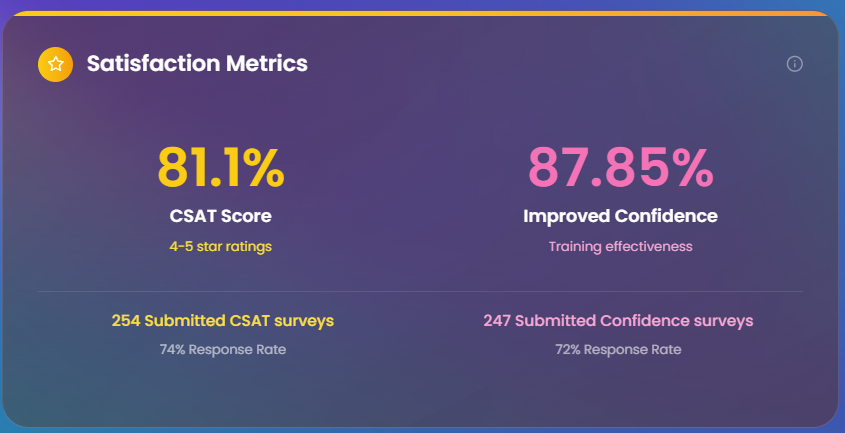
What data is shown
This panel answers: are learners satisfied with the training, and do they feel more confident afterward?
The data comes from short surveys that are shown to each user once per month. After the user submits or discards the survey, it is hidden until the following month. Two types of feedback are collected:
- CSAT (Customer Satisfaction) - Users rate their overall experience on a 1-to-5 star scale.
- Confidence - Users are asked whether they feel more confident in the skill they practiced.
Important: All-Time Data Unlike other sections in Usage Analytics, satisfaction metrics are not filtered by the selected time period. They show all-time survey data for the selected user groups and courses. This is intentional - satisfaction scores are most reliable when based on the full history of responses rather than a narrow time window.
CSAT Score
The CSAT Score (Customer Satisfaction Score) is displayed prominently in yellow. Once a month, each user is shown a satisfaction survey where they rate their experience on a 1-to-5 star scale. After they submit or discard the survey, it is hidden and will appear again the following month.
The CSAT score is calculated as:
CSAT = (number of responses with a rating of 4 or 5 stars) ÷ (total responses that gave a rating) × 100
Important details:
- Users who skipped the rating (gave a score of 0 or didn't answer) are not included in the calculation. They are excluded from both the numerator and the denominator.
- The score only reflects users who actively chose to rate their experience.
- For example, if 200 surveys were shown, 150 users gave a rating, and 120 of those rated 4 or 5 stars, the CSAT score is 120 ÷ 150 = 80%.
A higher CSAT score means more users are having a positive experience with their simulations.
Improved Confidence
The Improved Confidence score is shown in pink. As part of the same monthly survey, users are also asked whether they feel more confident in the skill they practiced. They can answer Yes, No, or skip the question.
The confidence score is calculated as:
Improved Confidence = (users who answered "Yes") ÷ (total users who answered Yes or No) × 100
Important details:
- Users who skipped the question (indicated by a score of -1) are not included in the calculation.
- Only users who actively responded are counted.
- For example, if 200 surveys were shown, 140 users answered the confidence question, and 112 said "Yes", the confidence score is 112 ÷ 140 = 80%.
Survey statistics
Below the two main scores, the panel shows response data for each metric:
| Metric | Details shown |
|---|---|
| CSAT Surveys | Number of users who gave a rating out of total surveys shown, and the response rate percentage |
| Confidence Surveys | Number of users who answered the confidence question out of total surveys shown, and the response rate percentage |
The response rate shows what proportion of users who were presented with a survey actually gave a rating or answered the question (as opposed to skipping it). A low response rate may mean the scores above are based on a smaller sample, which is important context when interpreting results.
Tooltip information for this section
An info tooltip at the top-right of the panel explains:
Represents all time data based on User Groups & Courses filters.
This means:
- The time period filter at the top of the page does not affect this panel. Even when "Current Month" is selected, satisfaction data still includes all historical surveys.
- The user groups and courses filters do apply. If a specific region or course is selected, only surveys from those users and courses are included.
This design ensures that satisfaction scores are based on a meaningful sample size rather than a potentially small number of responses within a narrow date range.
While the time period filter affects most sections, satisfaction metrics always show all-time data scoped to the selected user groups and courses.